3 Best Tools to Implement Kubernetes Observability
Three important Kubernetes observability tools that have become the de-facto industry standards for enterprises within the cloud-native community.
A properly managed and implemented observability system provides
DevOps with granular insights that can be used to debug and heal complex
systems. Observability combines monitoring, alerting, and logging with metrics
visualization and its analysis.
It allows development teams to get detailed insights into the real-time
performance of Kubernetes clusters and applications so that they can make
timely and informed actions. Here, in this blog, we’ve discussed three
important tools to implement Kubernetes Observability. Let’s take a look!

Kubernetes at Its Boom
Today, containers and microservices are emerging as the cornerstone of a flexible hybrid cloud strategy. Kubernetes have completely revolutionized the deployment and lifecycle management of containers across public clouds and private data centers. So profound was its effect that initially, Kubernetes was considered a “be-all and end-all” for software lifecycle management.
The Dynamic Nature of Kubernetes
However, things have changed. Now that the initial “hype” around Kubernetes in the industry has somewhat settled, it is clear that Kubernetes adoption can be a tough row to hoe. Considering microservices and containers is one critical piece of the cloud-native puzzle. The other part is also a must to crack for leveraging all its benefits. Organizations must understand how these systems work in their totality before embarking on a cloud-native journey.
Kubernetes, due to its dynamic nature, are unpredictable. Despite the best efforts, failures and performance bottlenecks in such systems are inevitable and can be difficult to separate. In such a complex environment, getting deep visibility into the behavior of enterprise applications becomes critical to solve bugs & issues instantly for seamless and rapid app delivery. But, a bigger challenge is how to monitor a Kubernetes cluster and its components.
The Importance of Observability- The 3 Main Pillars
IT decision-makers and tech strategists consider that observability plays an important role in the planning and operating phases of the software development life cycle. The three pillars of observability—metrics, logging, and tracing not only help teams to gain observability into the Kubernetes environment but also provides them with deep insights into the underlying infrastructure, regardless of the technology stack being used.
As per New Relic’s 2021 Observability Forecast report on the adoption of observability and the expected trends, 83% of the enterprises agree that the best Kubernetes observability strategy pivots on deploying a solution that can automatically collect and associate observability data from all available sources. This outlines enterprises’ need for a non-intrusive, friction-less approach to track observability for managing the cloud-native stack.
Here are three important Kubernetes observability tools that have become the de-facto industry standards for enterprises within the cloud-native community. The implementation of these Kubernetes monitoring tools will give DevOps & SRE teams the complete visibility of the cluster components required to maintain the Kubernetes environment.
Prometheus- Automating Collection and Storage of Observability Data
Prometheus is
an open-source monitoring and alerting tool that
provides in-depth insights into the system's performance. It is a cloud-native
time-series data store with a built-in query language for metrics. The tool has
in-built support for Kubernetes and containers. It can easily be run in
Kubernetes using a Kubernetes Operator or in
a stand-alone mode.
Prometheus uses exporters to bring third-party data into its
data store. There are a number of ready-to-use exporters maintained as part of
Prometheus. These include,
-Elasticsearch
stats exporter for Prometheus,
-the Exporter for MySQL server
metrics,
-and the Kafka exporter for
Prometheus.
Prometheus scrapes metrics from Kubernetes nodes, containers, pods, services, and user applications running in Kubernetes. To allow Prometheus to scrape metrics from applications, developers need to expose metrics via HTTP at the metrics endpoint. Prometheus uses a highly efficient PromQL query language and integrations with major databases and metrics collector agents such as Elasticsearch and Metricbeat.
In some cases, teams need to monitor components that cannot be scrapped. Using the Prometheus Pushgateway, which is a component of Prometheus, teams can collect metrics for extremely brief jobs and push time series directly into a Prometheus data store.
The Prometheus comprises interlocking components that include,
- Prometheus Server: It acts as the system’s “brain” by collecting various metrics and storing them in a time-series database.
- Prometheus Client libraries: These help users integrate their built services by sending metrics and data in a format that Prometheus can understand.
- Prometheus Alertmanager: This Prometheus component sends alerts and notifications to designated users when the tool detects anomalies and performance issues.
- Prometheus Visualization tools: These help in displaying metrics and data in a human-readable format. Users can also integrate Prometheus with Grafana, an open-source web application for analytics and data visualization.
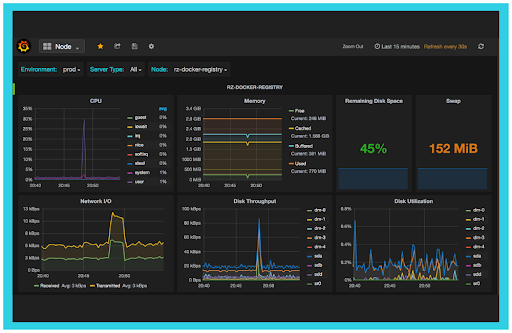
Collecting data with Prometheus helps DevOps teams capture
granular insights of the complete infrastructure and the containers running
within the Kubernetes cluster. To ensure efficient performance of Kubernetes
clusters in production, product teams must have a real-time understanding of
diverse metrics that tell about various issues such as memory or storage
shortage, node, network health, application errors, etc.
By providing in-depth visibility of the application's components usage, this
K8s monitoring tool helps in keeping a track of the performance of an
application for identifying bottlenecks and ways to get rid of them.
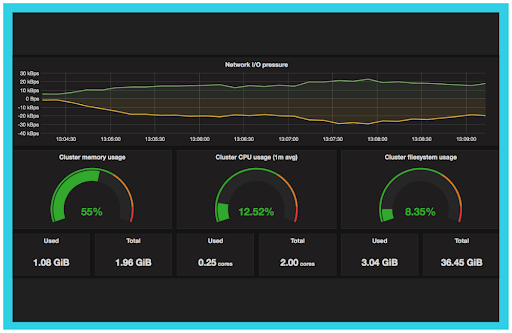
Grafana—Visualizing Observability Data
At times, raw metrics ( data that has not been processed) do not serve the best for the visualization of observability data. The reason is that they often consist of time series and text-based data with thousands of events, which cannot be untangled by human beings.
Grafana, an observability platform that can be easily deployed in Kubernetes, helps conquer the problem by processing raw metrics. According to Grafana documentation, this tool “allows teams to query, visualize, alert on, and understand metrics no matter where they are stored.” Grafana manages and executes all of this through its official and community-built dashboards. These dashboards can be downloaded and imported into the Grafana instance.
Grafana is a powerful data visualization and analytics tool that
supports alerting and notifications. The tool has integrations with
major time-series databases (Prometheus, InfluxDB), Elasticsearch, SQL
databases, cloud monitoring services, and many more. It operates via metrics
aggregations and powerful dashboards, making Kubernetes
observability a plain-sailing task.
You can read more about Grafana, its components, and how to
monitor a Kubernetes cluster here!
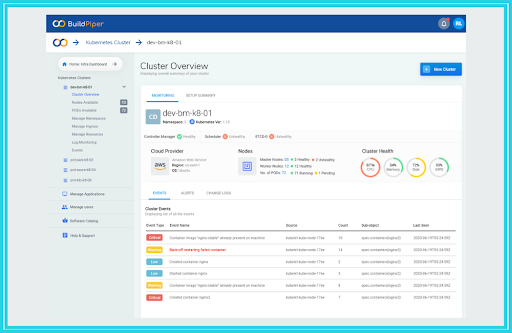
BuildPiper- Getting a Comprehensive View of the Kubernetes Cluster
BuildPiper
is a Kubernetes & Microservices Application Delivery platform that offers
a 360-degree view of the Kubernetes cluster. With BuildPiper, visibility and anomaly detection across the Kubernetes
clusters is reimagined to give teams an in-depth analysis in a few simple
clicks.
This Kubernetes monitoring tool has a Service Overview Dashboard that enables DevOps
teams to view and observe the build and deploy details and a Service Kubernetes
Dashboard that provides in-depth cluster observability capabilities to monitor
the performance, health status, CPU & memory allocation, node
availability, logs, and other important metrics.
The 360-degree view offered gives a clear picture of the performance, health status, availability, and functionality of the cluster components. It offers complete node visibility to enable viewing of the health status of the nodes. The pod health feature displays the real-time health status of the containers highlighting the environment variables and volume mounts for the pods present in the K8s cluster. Moreover, teams can keep a track of the real-time status of NameSpaces, Ingress, and other K8s assets of the Kubernetes cluster with the help of this monitoring tool.
Kubernetes Is Powerful, Only if Managed and Monitored Well
Due to the ephemeral and constantly-changing nature of
Kubernetes, a Kubernetes monitoring system demands the ability to recognize
changes automatically and continually monitor events, logs, pod health status,
and much more without any interruption.
Exploring solutions for how to monitor a Kubernetes cluster and
knowing metrics on finding faults, scanning cluster health status, and figuring
out ways to solve these issues are some of the common problems that enterprises
often face.
So, while choosing a Kubernetes deployment platform or a Kubernetes monitoring
tool, it’s important that the solution you opt for has the ability to keep a
track of these metrics and give a clear picture of what is exactly happening
inside the cluster to enable a hassle-free Kubernetes deployment.
We Provide consulting, implementation, and management services on DevOps, DevSecOps, Cloud, Automated Ops, Microservices, Infrastructure, and Security
Services offered by us: https://www.zippyops.com/services
Our Products: https://www.zippyops.com/products
Our Solutions: https://www.zippyops.com/solutions
For Demo, videos check out YouTube Playlist: https://www.youtube.com/watch?v=4FYvPooN_Tg&list=PLCJ3JpanNyCfXlHahZhYgJH9-rV6ouPro
If this seems interesting, please email us at [email protected] for a call.
Relevant blogs:
Testing Your Infrastructure as Code Using Terratest
To Shift Right, You Need Observability
DevOps for Enterprise - Are You Doing It Right?
Recent Comments
No comments
Leave a Comment
We will be happy to hear what you think about this post