Deploying prometheus on kubernetes

Monitoring is one of the pillars of successful infrastructure. It has been called the base of the hierarchy of reliability. Monitoring is a must-have for responding to incidents, detecting and debugging systemic problems, planning for the future, and generally understanding your infrastructure
Create a namespace and clusterrole
we will create a Kubernetes namespace for all our monitoring components. If we don’t create a dedicated namespace, all the Prometheus Kubernetes deployment objects get deployed on the default namespace
command to create a new namespace named monitoring
$kubectl create namespace monitoring
create an RBAC policy with read access to required API groups and bind the policy to the monitoring namespace
# cat clusterRole.yaml
apiVersion: rbac.authorization.k8s.io/v1
kind: ClusterRole
metadata:
name: prometheus
rules:
- apiGroups: [""]
resources:
- nodes
- nodes/proxy
- services
- endpoints
- pods
verbs: ["get", "list", "watch"]
- apiGroups:
- extensions
resources:
- ingresses
verbs: ["get", "list", "watch"]
- nonResourceURLs: ["/metrics"]
verbs: ["get"]
---
apiVersion: rbac.authorization.k8s.io/v1
kind: ClusterRoleBinding
metadata:
name: prometheus
roleRef:
apiGroup: rbac.authorization.k8s.io
kind: ClusterRole
name: prometheus
subjects:
- kind: ServiceAccount
name: default
namespace: monitoring
create the role using the following command
# kubectl create -f clusterRole.yaml
clusterrole.rbac.authorization.k8s.io/prometheus created
create a config map to externalize prometheus configuration
All configurations for Prometheus are part of prometheus.yaml file and all the alert rules for Alertmanager are configured in prometheus.rules.
By externalizing Prometheus configs to a Kubernetes config map, we don’t have to build the Prometheus image whenever you need to add or remove a configuration. we need to update the config map and restart the Prometheus pods to apply the new configuration.
Create a file called config-map.yaml and copy the file contents from this link to Prometheus Config File.
Execute the following command to create the config map in Kubernetes
# kubectl create -f config-map.yaml
configmap/prometheus-server-conf created
create a prometheus deployment
create a file named prometheus-deployment.yaml and copy the following contents onto the file. In this configuration, we are mounting the Prometheus config map as a file inside /etc/prometheus as explained in the previous section
# cat prometheus-deployment.yaml
apiVersion: apps/v1
kind: Deployment
metadata:
name: prometheus-deployment
namespace: monitoring
labels:
app: prometheus-server
spec:
replicas: 1
selector:
matchLabels:
app: prometheus-server
template:
metadata:
labels:
app: prometheus-server
spec:
containers:
- name: prometheus
image: prom/prometheus
args:
- "--config.file=/etc/prometheus/prometheus.yml"
- "--storage.tsdb.path=/prometheus/"
ports:
- containerPort: 9090
volumeMounts:
- name: prometheus-config-volume
mountPath: /etc/prometheus/
- name: prometheus-storage-volume
mountPath: /prometheus/
volumes:
- name: prometheus-config-volume
configMap:
defaultMode: 420
name: prometheus-server-conf
- name: prometheus-storage-volume
emptyDir: {}
# kubectl create -f prometheus-deployment.yaml
deployment.apps/prometheus-deployment created
# kubectl get deployments --namespace=monitoring
NAME READY UP-TO-DATE AVAILABLE AGE
prometheus-deployment 1/1 1 1 3m55s
Viewing Prometheus dashboard
Connecting to Prometheus (exposing Prometheus as a service): To access the Prometheus dashboard over an IP or a DNS name, you need to expose it as a Kubernetes service. Create a file named prometheus-service.yaml and copy the following contents. We will expose Prometheus on all Kubernetes node IPs on port 30000.
# cat prometheus-service.yaml
apiVersion: v1
kind: Service
metadata:
name: prometheus-service
namespace: monitoring
annotations:
prometheus.io/scrape: 'true'
prometheus.io/port: '9090'
spec:
selector:
app: prometheus-server
type: NodePort
ports:
- port: 8080
targetPort: 9090
nodePort: 30000
Create the service using the following command
root@ciskubemaster:~/wrkspace/prometheus/kubernetes-prometheus# kubectl create -f prometheus-service.yaml --namespace=monitoring
Once created, you can access the Prometheus dashboard using any Kubernetes node IP on port 30000.
Go to node and give endpoint IP: 30000

Querying
As soon as it starts, the Prometheus pod will be accumulating data. After a few minutes, you’ll have some records that you can query using Prometheus’s powerful query language. Kubernetes collects container metrics through cAdvisor. You can see all of the metrics that Kubernetes and cAdvisor provide out of the box in the dropdown menu on the query interface.
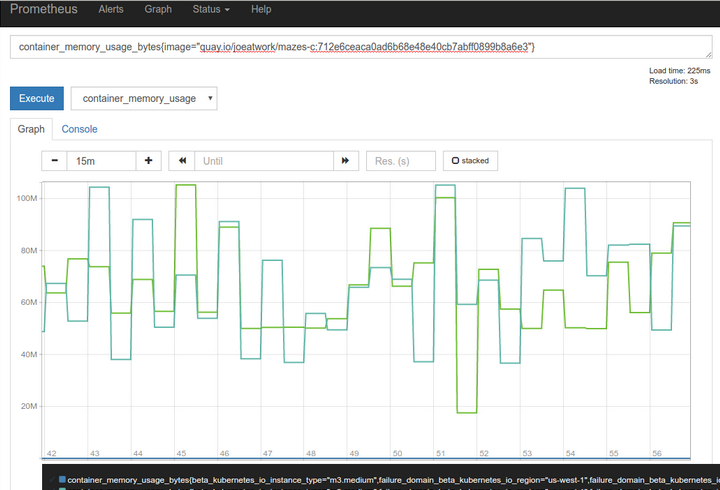
The CPU, memory, I/O, and network activity of your running containers are all measured, collected, and made available for queries and alerts. For example, you can see the memory usage of all of the containers running a particular image with a query like
container_memory_usage_bytes{image="CONTAINER:VERSION"}
Querying a container by image
It might not always be convenient to know the precise version of your container images - or perhaps you’d like to see memory usage across all versions of your image. For cases like these, the Prometheus query language supports regular expressions when matching events. You can rewrite your memory usage query as:
container_memory_usage_bytes{image=~"CONTAINER:.*"}
This is more convenient to type and more flexible across changes. Note that the equals sign after image, “=”, has been changed to an equals sign and tilde, “=~”, to indicate that the value in quotation marks is a regular expression.
With Prometheus monitoring, Kubernetes, container- and image-level querying is just the beginning. Kubernetes annotates your container metrics with metadata that you can use to get a refined, application-level view of the performance of your workloads. Container-level metrics are labeled with the Kubernetes pod and namespace they are associated with. That means you can “zoom-out” from the container to the application and the cluster layers, to answer increasingly global questions.
For example, how much memory are the tools in the Kube-system namespace using? That’s a question you can answer with a query like:
sum(container_memory_usage_bytes{kubernetes_namespace="kube-system"})
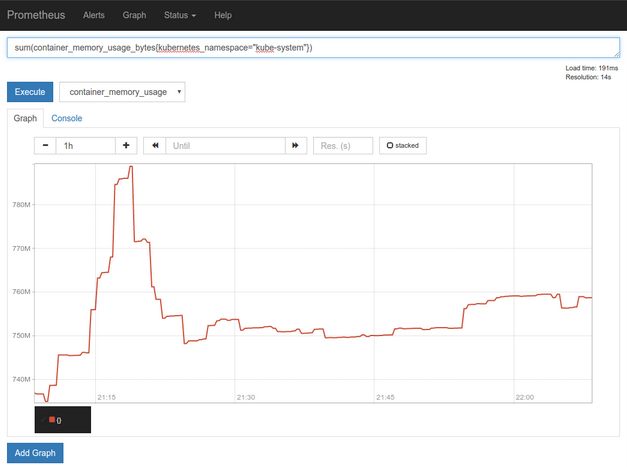
Something to note here is that we’ve been using the same query tools to inspect the behavior and performance of Kube-DNS, a core Kubernetes service, that you might use to inspect the applications you deploy to Kubernetes yourself. Right now, as long as a pod includes at least one container that exposes at least one port, Prometheus’s automatic service discovery will include it in the data collection.
Recent Comments
No comments
Leave a Comment
We will be happy to hear what you think about this post