Detect Proactively Whether Application’s Memory Is Under-allocated
To prevent OutOfMemoryError, in this post, we will discuss how to detect whether your application’s memory is under-allocated or not in a proactive manner.
When the application’s memory is under-allocated, it will result in the following side-effects:
a. Transactions response time will degrade
b. CPU consumption will spike up
c. OutOfMemoryError will be thrown
Only when OutOfMemoryError is thrown, most of us start to look at our application’s memory settings. This is like only when a patient goes to a critical condition; we begin to give treatment :-).
In this post, let’s discuss how to detect whether your application’s memory is under-allocated or not in a proactive manner.
Study Garbage Collection Behavior
Studying the garbage collection behavior of the application will clearly indicate whether your application’s memory is under-allocated or over-allocated than the actual requirement. You can study the garbage collection behavior of your application by following these two simple steps:
1. To study the Garbage collection behavior, you first need to enable the Garbage collection log on your application. The garbage collection log can be enabled by passing the JVM arguments mentioned in this post. Enabling a garbage collection log doesn’t add any observable overhead to your application. Thus you can consider enabling garbage collection log on all your production JVMs.
2. Once garbage collection logs are captured, you can use free GC log analysis tools such as IBM GC Visualizer, GCeasy, Google Garbage Cat, HP Jmeter to study the Garbage Collection behavior.
Let’s discuss what metrics and patterns you need to look at in the Garbage Collection report to determine whether your application’s memory is under-allocated or not.
Healthy Normal application
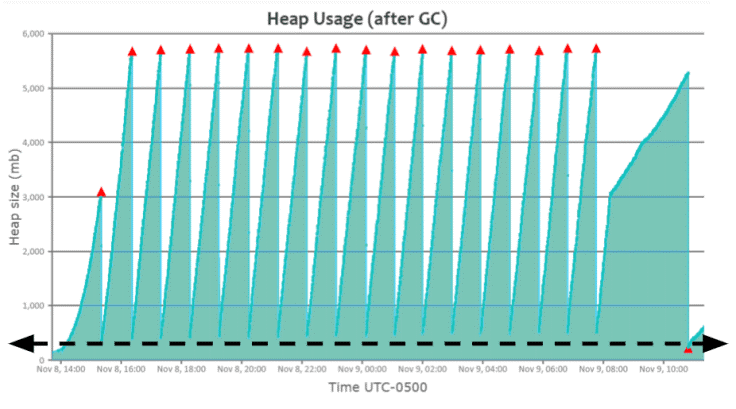
Above is the heap usage graph generated by the GCeasy tool by parsing the garbage collection log file. As shown in the above graph, you can see a beautiful saw-tooth pattern. Heap usage will keep rising; once a ‘Full GC’ event is triggered, heap usage will drop all the way to the bottom. It indicates that the application is in a healthy condition.
In Fig 1, You can notice that the ‘Full GC’ event (i.e., red triangle) runs approximately when the heap usage reaches ~5.8GB. When the ‘Full GC’ event runs, memory utilization drops all the way to the bottom i.e., ~200MB (Please refer to the dotted black arrow line in the graph). It indicates that the application is in a healthy state & not suffering from any sort of memory problems.
Memory Under-allocated Application Pattern-1
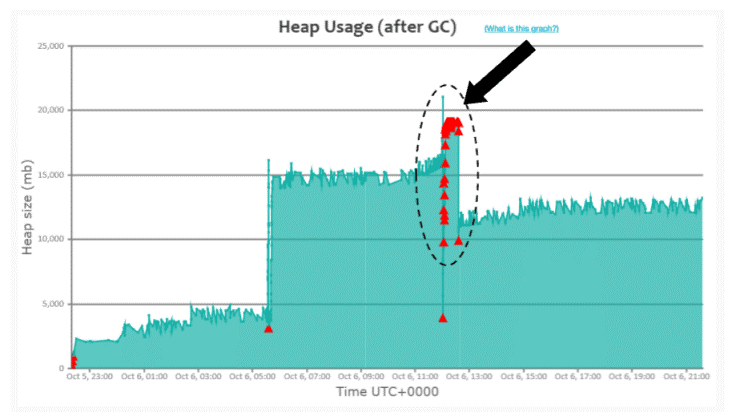
In Fig 2. you can notice that from 12:02 pm to 12:30 pm on Oct’ 06, ‘Full GC’s (i.e., red triangle) are consecutively running (Please refer to the black arrow mark); however, heap usage isn’t dropping during that time frame. It indicates that the application is creating a lot of objects during that time frame. The application was creating a lot of new objects because of the spike in traffic volume during that time frame. Since objects are created at a rapid phase, GC events also started to run consecutively.
Whenever a GC event runs, it has two side effects:
a. CPU consumption will go high (since GC does an enormous amount of computation).
b. Entire application will be paused; no customers will get a response.
Thus, during this time frame, 12:02 pm to 12:30 pm on Oct’ 06, the application’s CPU consumption would have been skyrocketing and customers wouldn’t be getting back any response. Here is the real-world GC log analysis report which was suffering from this ‘Consecutive Full GC’ problem. When this kind of pattern surfaces, it’s a clear indication that your application needs more memory than what you have allocated.
When this problematic pattern surfaces, you can also follow one of the approaches outlined in this post to resolve the problem.
Memory Under-allocated Application Pattern-2
If you notice in Fig 2, after 12:30 pm on Oct’ 6, the application recovered and started to function normally. It’s because traffic volume died down after 12:30 pm. Once traffic volume died down, the application’s object creation rate went down. Since the object creation rate went down, Full GCs also stopped running consecutively. However, in certain applications, you might see the GC pattern to appear like this as well:
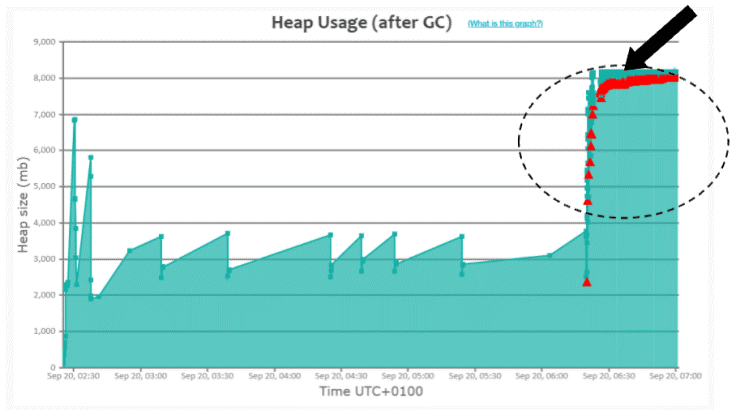
Please refer to the black arrow in Fig 3. You can notice that ‘Full GC’ (i.e., red triangle) events are continuously running. Here is the real-world GC log analysis report, which depicts this pattern. This pattern is similar to the previous pattern as highlighted in Fig 2, with one sharp difference. In the previous pattern, the application recovered from consecutive Full GC runs and returned to a normal functioning state once traffic volume died down. However, in Fig 3, consecutive Full GCs never stopped running until the application got restarted. When you see Fig 3 type of pattern, there could be two possibilities:
a. Application needs more memory (due to spike in traffic volume)
b. Application is suffering from a memory leak
Now the question is: ‘How to isolate whether it’s #a or #b causing this problematic pattern?’. Try removing your JVM instance from the load balancer and stop the traffic. If the problem is triggered because of the spike in traffic volume, Full GCs will stop running, and heap usage will drop back to the normal level. However, Full GCs will continue to run consecutively if it’s a memory leak, and heap usage will not drop back to the normal level.
Note: If the application is suffering from a memory leak, you can use tools like yCrash, HeapHero, Eclipse MAT to diagnose memory leak.
Conclusion
Thus, by performing Garbage collection log analysis as outlined in this post, you would be able to determine whether your application’s memory is under-allocated or not in a proactive manner.
We ZippyOPS, Provide consulting, implementation, and management services on DevOps, DevSecOps, Cloud, Automated Ops, Microservices, Infrastructure, and Security
Services offered by us: https://www.zippyops.com/services
Our Products: https://www.zippyops.com/products
Our Solutions: https://www.zippyops.com/solutions
For Demo, videos check out YouTube Playlist: https://www.youtube.com/watch?v=4FYvPooN_Tg&list=PLCJ3JpanNyCfXlHahZhYgJH9-rV6ouPro
Relevant Blogs:
Getting Started With Kubernetes In 2 Days
What Managed Kubernetes Service is Best for SREs?
What Keycloak Is and What It Does?
Is Windows 11 Safer Than Windows 10?
Recent Comments
No comments
Leave a Comment
We will be happy to hear what you think about this post