A Comprehensive Approach to Performance Monitoring and Observability
Delve into core concepts of observability and monitoring and how the modern observability approach differs from/complements traditional monitoring practices.
Agile development practices must be supported by an agile monitoring framework. Overlooking the nuances of the system state — spanning infrastructure, application performance, and user interaction — is a risk businesses can't afford. This is particularly true when performance metrics and reliability shape customer satisfaction and loyalty, directly influencing the bottom line.
Traditional application performance monitoring (APM) tools were initially designed for environments that were more static and predictable. These tools were designed to track neither the swift, iterative changes of microservice architectures nor the complexities of cloud-native applications. This led to the gradual evolution of the modern observability approach that leveraged the data collection principles of APM and extended them to provide deeper insights into a system's state.
In this article, we delve into the core concepts of observability and monitoring while discussing how the modern observability approach differs from and complements traditional monitoring practices.
Optimizing Application Performance Through Data Quality
Performance metrics are only as reliable as the data feeding them. Diverse data sources, each with their own format and scale, can convolute the true picture of application performance. Given the "garbage in, garbage out" challenge, data normalization serves as the corrective measure where a dataset is reorganized to reduce redundancy and improve data integrity. The primary aim is to ensure that data is stored efficiently and consistently, which makes it easier to retrieve, manipulate, and make sense of.
For APM, there are various normalization techniques that help bring heterogeneous data onto a common scale so that it can be compared and analyzed more effectively:
- Unit conversion – standardizing units of measure, like converting all time-based metrics to milliseconds
- Range scaling – adjusting metrics to a common range; useful for comparing metrics that originally existed on different scales
- Z-score normalization – converting metrics to a standard distribution, which is especially useful when dealing with outlier values
Monitoring vs. Observability: Core Concepts
In optimizing application performance, monitoring and observability play equally critical but distinct roles. Some often inaccurately use the terms interchangeably, but there's a nuanced difference. Monitoring follows a proactive approach of collecting data points based on predefined thresholds and setting up alarms to flag anomalies. This essentially answers the question, Is my system working as expected?
On the other hand, observability allows for deep dives into system behavior, offering insights into issues that you didn't know existed. The approach helps you answer, Why isn't my system working as expected?
Example Use Case: E-Commerce Platform
For context, consider an e-commerce platform where application uptime and user experience are critical. To ensure everything is running smoothly, the right blend of monitoring and observability strategies can be broken down as follows.
|
MONITORING VS. OBSERVABILITY FOR AN E-COMMERCE PLATFORM |
||
|
Strategy Type |
Strategy Name |
Purpose |
|
Monitoring |
Availability checks |
Regular pings to ensure the website is accessible |
|
Latency metrics |
Measuring page load times to optimize user experience |
|
|
Error rate tracking |
Flags raised if server errors like "404 Not Found" exceed a threshold |
|
|
Transaction monitoring |
Automated checks for crucial processes like checkout |
|
|
Observability |
Log analysis |
Deep inspection of server logs to trace failed user requests |
|
Distributed tracing |
Maps the path of a request through various services |
|
|
Event tagging |
Custom tags in code for real-time understanding of user behavior |
|
|
Query-driven exploration |
Ad hoc queries to examine system behavior |
Table 1
Synergy Between Monitoring and Observability
Monitoring and observability don't conflict; instead, they work hand-in-hand to develop an efficient APM framework. Integrating monitoring and observability will allow you to realize numerous advantages, including those listed below:
- Enhanced coverage– Monitoring identifies known issues while observability lets you explore the unknown. From system crashes to subtle performance degradations, everything gets covered here.
-
In
practical terms, this may mean simply not knowing that your server
responded with a
500error but also understanding why it occurred and what its effects are to the entire ecosystem. - Improved analysis – A blended approach enables you to pivot from what is happening to why it's happening. This is crucial for data-driven decision-making. You can allocate resources more effectively, prioritize bug fixes, or even discover optimization opportunities you didn't know existed.
- For example, you might find that certain API calls are taking longer only during specific times of the day and trace it back to another internal process hogging resources.
- Scalability– As your system grows, its complexity often grows exponentially. The scalability of your APM can be significantly improved when both monitoring and observability work in sync. Monitoring helps you keep tabs on performance indicators, but observability allows you to fine-tune your system for optimal performance at scale.
- As a result, you achieve a scalable way to not just proactively identify bottlenecks and resource constraints but also to investigate and resolve them.
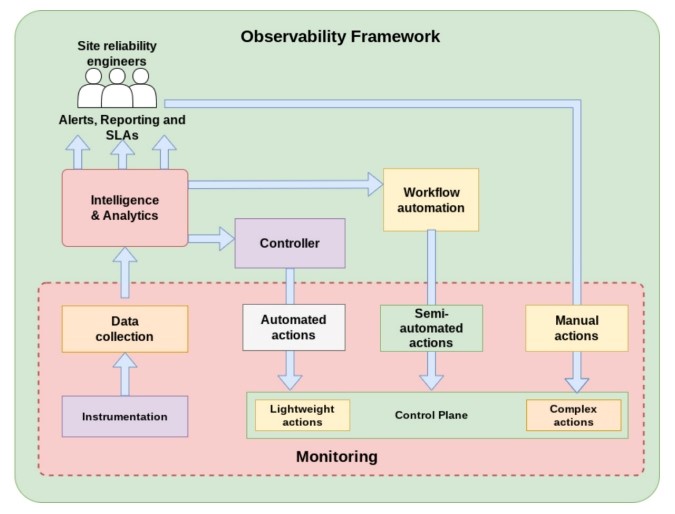
Figure 1: How observability and monitoring overlap
Creating a Cohesive System
Synergizing monitoring and observability is one of the most critical aspects of building a robust, scalable, and insightful APM framework. The key here is to build an environment where monitoring and observability are not just coexisting but are codependent, thus amplifying each other's efficacy in maintaining system reliability. While different use cases may require different approaches, consider the following foundational approaches to build a cohesive monitoring and observability stack.
Unified Data Storage and Retrieval
The first step towards creating a cohesive analytics pipeline is unified data storage. A single data storage and retrieval system enhances the speed and accuracy of your analytics. Your performance analysis stack should accommodate both fixed metrics from monitoring and dynamic metrics from observability. At its core, the underlying system architecture should be capable of handling different data types efficiently. Solutions like time series databases or data lakes can often serve these varied needs well. However, it's crucial to consider the system's capability for data indexing, searching, and filtering, especially when dealing with large-scale, high-velocity data.
Interoperability Between Specialized Tools
An agile APM system relies on seamless data exchange between monitoring and observability tools. When each tool operates as a disjointed/standalone system, the chances of getting siloed data streams and operational blind spots increase. Consider building an interoperable system that allows you to aggregate data into a single, comprehensive dashboard. Opt for tools that adhere to common data formats and communication protocols. A more advanced approach of achieving this is to leverage a custom middleware to serve as a bridge between different tools. As an outcome, you can correlate monitoring KPIs with detailed logs and traces from your observability tools.
Data-Driven Corrective Actions
Knowing exactly what needs to be fixed allows for quicker remediation. This speed is vital in a live production environment where every minute of suboptimal performance can translate to lost revenue or user trust. When your monitoring system flags an anomaly, the logical next step is a deep dive into the underlying issue. For instance, a monitoring system alerts you about a sudden spike in error rates, but it doesn't tell you why. Integrating observability tools helps to correlate the layers. These tools can sift through log files, query databases, and analyze trace data, ultimately offering a more granular view. As a result, you're equipped to take targeted, data-driven actions.
To streamline this further, consider establishing automated workflows. An alert from the monitoring system can trigger predefined queries in your observability tools, subsequently fast-tracking the identification of the root cause.
Distinguishing Monitoring From Observability
While the approach of monitoring and observability often intersect, their objectives, methods, and outcomes are distinct in the following ways.
Metrics vs. Logs vs. Traces
Monitoring primarily revolves around metrics. Metrics are predefined data points that provide quantifiable information about your system's state, indicating when predefined thresholds are breached. These are typically numerical values, such as CPU utilization, memory usage, or network latency. Observability, on the other hand, focuses typically on logs and traces. Logs capture specific events and information that are essential for deep dives when investigating issues. These contain rich sources of context and detail, allowing you to reconstruct events or understand the flow of a process.
Traces additionally provide a broader perspective. They follow a request's journey through your system, tracking its path across various services and components. Traces are particularly useful in identifying bottlenecks, latency issues, and uncovering the root causes of performance problems.
Reactive vs. Proactive Management
Focusing on predefined thresholds through metrics, monitoring predominantly adopts a reactive management approach. When a metric breaches these predefined limits, it offers quick responses to support a broader performance analysis strategy. This reactive nature of monitoring is ideal for addressing known problems promptly but may not be well-suited for handling complex and novel issues that require a more proactive and in-depth approach.
While monitoring excels at handling known issues with predefined thresholds, observability extends the scope to tackle complex and novel performance challenges through proactive and comprehensive analysis. This dynamic, forward-looking approach helps constantly analyze data sources, looking for patterns and anomalies that might indicate performance issues, such as a subtle change in response times, a small increase in error rates, or any other deviations from the expected behavior. Observability then initiates a comprehensive investigation to understand the root causes and take corrective actions.
Fixed Dashboards vs. Ad Hoc Queries
Monitoring systems typically feature fixed dashboards to display a predefined set of metrics and performance indicators. Most modern monitoring tools can be configured with specific metrics and data points that are considered essential for tracking the system's well-being. The underlying metrics can be selected based on the historical understanding of the system and industry best practices. Although fixed dashboards are optimized to answer known questions efficiently, they lack the flexibility to address unforeseen or complex problems and may not provide the necessary data points to investigate effectively.
Conversely, observability offers a dynamic and real-time approach to querying your system's performance data. These ad hoc queries can be tailored to specific, context-sensitive issues. The technical foundation of such queries lies in their ability to analyze vast amounts of data from diverse sources and over a rich dataset that includes metrics, logs, and traces. This flexible querying capability provides invaluable flexibility for troubleshooting new or unanticipated issues. When a previously unseen problem occurs, you can create custom queries to extract relevant data for detailed analysis.
The following comparative table emphasizes how each set of key performance indicators (KPIs) aligns with the underlying philosophy and how monitoring and observability contribute to system management:
|
MONITORING VS. OBSERVABILITY KPIS |
||
|
KPIs |
Monitoring |
Observability |
|
Primary objective |
Ensure system is functioning within set parameters |
Understand system behavior and identify anomalies |
|
Nature of data |
Metrics |
Metrics, logs, traces |
|
Key metrics |
CPU usage, memory usage, network latency |
Error rates, latency distribution, user behavior |
|
Data collection method |
Pre-defined data points |
Dynamic data points |
|
Scope |
Reactive: addresses known issues |
Proactive: explores known and unknown issues |
|
Visual representation |
Fixed dashboards |
Ad hoc queries, dynamic dashboards |
|
Alerts |
Threshold-based |
Anomaly-based |
|
Scale of measurement |
Usually single-dimension metrics |
Multi-dimensional metrics |
Table 2
Conclusion
The strength of a perpetually observable system is its proactive nature. To harness the full potential of observability though, one must capture the right data — the kind that deciphers both predictable and unpredictable production challenges. Embrace a culture that emphasizes refining your application's instrumentation. A recommended approach is to set up a stack where any query about your app's performance gets its due response. It is also important to note that observability is an evolving process and not a one-time setup.
As your application scales and changes, so should your instrumentation capabilities. This approach ensures that queries — whether they probe routine operations or unexpected anomalies — receive the informed responses that only a finely tuned, responsive observability framework can provide.
We Provide consulting, implementation, and management services on DevOps, DevSecOps, DataOps, Cloud, Automated Ops, Microservices, Infrastructure, and Security
Services offered by us: https://www.zippyops.com/services
Our Products: https://www.zippyops.com/products
Our Solutions: https://www.zippyops.com/solutions
For Demo, videos check out YouTube Playlist: https://www.youtube.com/watch?v=4FYvPooN_Tg&list=PLCJ3JpanNyCfXlHahZhYgJH9-rV6ouPro
If this seems interesting, please email us at [email protected] for a call.
Recent Comments
No comments
Leave a Comment
We will be happy to hear what you think about this post