A Roadmap to True Observability

Navigate the path to comprehensive telemetry: Receive guidance for your observability journey, starting with defining the significance of "true" observability.
Observability is essential in any modern software development and production environment. It allows teams to better identify areas of improvement, enabling them to make informed decisions about their development processes. Telemetry, being a critical part of observability, refers to the continuous nature of data collection. This data enables organizations to paint a picture of the whole system's health and achieve a higher level of observability and responsiveness in managing their applications.
This article will provide some guidance for your observability journey, starting with defining the significance of "true" observability. It will explore the different observability maturity models, examining the steps required to ascend the maturity ladder, as well as the challenges and solutions involved in advancing maturity levels.
Additionally, it will cover techniques for adopting observability, including how to get started, best practices for implementing it, and how to generate useful performance data. Lastly, the article will cover the role of automation and AI in observability and how comprehensive telemetry can impact overall application performance.
Defining "True" Observability
In the domain of application performance management, the term "observability" has evolved beyond its traditional monitoring roots, getting to a level often referred to as "true" observability. At its core, "true" observability is more than just keeping an eye on your systems; it's a holistic approach that provides a 360-degree view of your whole system: infrastructure, applications, and services.
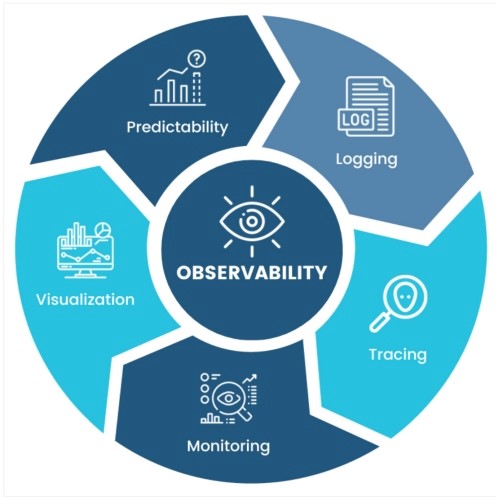
Figure 1: Observability pillars
Traditional monitoring typically involves a collection of specific performance metrics and predefined thresholds to help better identify known issues and alert administrators when those thresholds are exceeded. It primarily focuses on basic health checks, like system uptime, CPU, and memory utilization, thus providing a simplified view of a system's behavior. This makes traditional monitoring often limited in the ability to diagnose more complex problems or identify underlying causes, as it lacks the depth and data granularity of "true" observability.
Traditional monitoring tends to be passive, addressing only well-understood issues, and may not keep pace with the dynamic nature of modern, distributed applications and infrastructure. Moving from traditional monitoring to true observability means incorporating a data-rich approach that relies on in-depth telemetry.
Unlike traditional monitoring, which often focuses on surface-level metrics, "true" observability incorporates metrics, traces, and logs, providing a more detailed and nuanced view of application behavior. This helps to identify the root cause of issues, giving teams visibility into the entire ecosystem, and providing a more comprehensive picture of not just what's happening in the system, but why and how it's happening.
Ultimately, true observability empowers teams to deliver more reliable, responsive, and efficient applications that elevate the overall user experience.
The Observability Maturity Model
In order to achieve "true" observability, it's important to understand the Observability Maturity Model. This model outlines the stages through which organizations evolve in their observability practices, acting as a roadmap. Here, we'll describe each maturity stage, highlight their advantages and disadvantages, and offer some practical tips for moving from one stage to the next.
As seen in Table 1, the Observability Maturity Model is broken down into four distinct levels of observability: initial, awareness, proactive, and predictive.
|
OBSERVABILITY MATURITY STAGES: ADVANTAGES AND DISADVANTAGES |
|||
|
Maturity Stage |
Purpose |
Advantages |
Disadvantages |
|
Initial |
Also called the monitoring level, this is where the basic health of individual system components is tracked. Alarms and notifications are triggered to signal that something went wrong. |
|
|
|
Awareness |
This is the observability level, where you have more insights into system behavior by observing its outputs. It focuses on results from metrics, logs, and traces, combined with existing monitoring data to help answer what went wrong and why. |
|
|
|
Proactive |
This stage provides more comprehensive insights to help understand the problem's origin and consequences. Building upon Stages 1 and 2, it adds the ability to track topology changes over time in the stack and generates extensive, correlated information that helps identify what went wrong quicker, why the issue occurred, when it started, and what areas are impacted. |
|
|
|
Predictive |
This is called the intelligent observability phase, as the usage of AI/ML algorithms helps identify error correlation patterns and offers remediation workflows. Here you start understanding how to predict anomalies and automate response. |
|
|
Table 1
Adopting "True" Observability
After understanding the Observability Maturity Model, it's essential to explore the multifaceted approach companies must embrace for a successful observability transition. Despite the need to adopt advanced tools and practices, the path to "true" observability can demand significant cultural and organizational shifts. Companies must develop strategies that align with the observability maturity model, nurture a collaborative culture, and make cross-team communication a priority.
The rewards are quite substantial — faster issue resolution and improved user experience, making "true" observability a transformative journey for IT businesses.
How To Get Started With Observability
If your organization is at the beginning of your observability journey, make sure to start by assessing your current monitoring capabilities and identifying gaps. Invest in observability tools and platforms that align with your maturity level, making sure you capture metrics, logs, and traces effectively. Set clear objectives and key performance indicators (KPIs) to measure progress along the way.
As you establish a cross-functional observability team and promote a culture of knowledge sharing and collaboration, you'll be well-prepared to move forward in your observability journey.
Generating Useful Performance Data
Central to this journey is the effective generation of performance data. Telemetry data — metrics, logs, and traces — provide insights into system health and performance. To get started, define what data is most important to your unique system needs.
Logging for Clarity and Accessibility
Implement structured logging practices that ensure logs are accessible and clear. Logs offer insights into system behavior, errors, and transactions, so it's critical to ensure the consistency of logs in a standardized format. Prioritize log accessibility by implementing log aggregation solutions that centralize logs from multiple sources in the system. This centralized access simplifies troubleshooting and anomaly detection.
Metrics for Insights
Metrics provide quantifiable data points that encapsulate the critical aspects of your applications, like traffic, latency, error rates, and saturation. Define clear objectives and benchmarks for these metrics, and provide a baseline for performance assessment. Implement monitoring tools that can capture, store, and visualize these metrics in real-time, and analyze them regularly to make data-driven decisions.
Tracing to Precision
Distributed tracing is a powerful tool for understanding the complex flows in today's modern architectures. To implement effective tracing, start by generating trace data in your applications. Ensure these traces are correlated, providing a detailed view of request paths and interactions between services. Invest in tracing tools that can visualize these traces and offer solutions for root cause analysis. This can help pinpoint performance bottlenecks, troubleshoot quickly, and maintain a precise understanding of your system.
The Role of Automation and AI
On the journey to "true" observability, automation and AI become your allies in harnessing the full potential of the data you've collected. They offer capabilities that can elevate your observability game to the next level. Using automation, you can streamline the process of generating insights from the data, and detect patterns and anomalies with AI-driven algorithms.
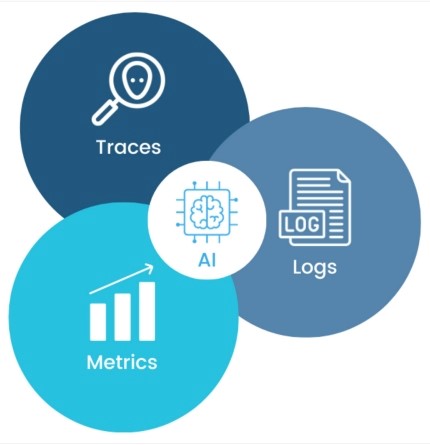
Figure 2: AI at the heart of observability
Using automation and AI, you can analyze telemetry data to identify deviations from expectations. They can recognize early warning signals and predict performance degradation. AI algorithms can sift through vast amounts of data, identify causes, and provide actionable insights to your operators.
AI-driven observability doesn't stop at identification and analysis but can extend to intelligent remediation. When an issue is detected, AI can help provide the instructions for resolution and suggest actions to be taken or changes to be implemented in the system.
With AI's assistance, your Ops team can be more efficient and effective, ensuring minimal disruption and optimal system availability.
Conclusion
In the evolving landscape of IT and application performance management, true observability is a guide through the complexities of modern systems. As environments become more dynamic, distributed, and modular, adopting true observability is a necessity, rather than a luxury.
This article uncovered the layers of observability, from understanding the foundations of monitoring to achieving proactive observability with automation and AI. We explored the significance of each maturity level, highlighting the need for cultural and organizational shifts, and we emphasized the benefits of faster issue resolution and an improved user experience. Lastly, we covered the way to adopt "true" observability and the components of a telemetry ecosystem: metrics, traces, and logs, as well as the role of automation and AI for more effective collection, storage, and analysis of the telemetry data.
Moving forward, the key takeaway is that the goal of true observability isn't just to collect data; it's to harness its power to deliver seamless and reliable user experiences.
We Provide consulting, implementation, and management services on DevOps, DevSecOps, DataOps, Cloud, Automated Ops, Microservices, Infrastructure, and Security
Services offered by us: https://www.zippyops.com/services
Our Products: https://www.zippyops.com/products
Our Solutions: https://www.zippyops.com/solutions
For Demo, videos check out YouTube Playlist: https://www.youtube.com/watch?v=4FYvPooN_Tg&list=PLCJ3JpanNyCfXlHahZhYgJH9-rV6ouPro
If this seems interesting, please email us at [email protected] for a call.
Recent Comments
No comments
Leave a Comment
We will be happy to hear what you think about this post