Achieving Kubernetes Monitoring Nirvana: Prometheus and Grafana Unleashed

Master the art of Kubernetes monitoring by setting up Prometheus and Grafana for real-time insights into your clusters and actionable dashboards.
In the ever-evolving landscape of container orchestration, Kubernetes has emerged as a frontrunner, offering unparalleled flexibility and scalability. However, with great power comes great responsibility — the responsibility to monitor and understand your Kubernetes clusters effectively. This is where Prometheus and Grafana step in, forming a dynamic duo that provides comprehensive insights into Kubernetes clusters.
Understanding Kubernetes and KIND
Before diving into the monitoring aspect, let's understand Kubernetes. It's an open-source system for automating the deployment, scaling, and management of containerized applications. For our setup, we use Kubernetes IN Docker (KIND), which is an excellent tool for running local Kubernetes clusters using Docker containers.
Setting up KIND Cluster
Assuming you have Docker and KIND installed, setting up a 3-node cluster named 'monitoring' is straightforward. Here's how you do it:
kind create cluster --name monitoring --config kind-config.yaml
Ensure kind-config.yaml specifies three nodes. This will set up a local Kubernetes environment perfect for our monitoring setup.
The Role of Prometheus and Grafana
Prometheus, an open-source monitoring solution, collects and stores metrics as time-series data. Grafana, on the other hand, is an analytics and visualization platform that makes sense of these metrics. Together, they offer a robust monitoring solution.
Installing Prometheus and Grafana Using Helm
Helm, the Kubernetes package manager, simplifies the installation of software on Kubernetes clusters. We'll use Helm charts to deploy Prometheus and Grafana into our 'monitoring' namespace.
1. Add Helm Repositories
Add the required Helm repositories:
helm repo add prometheus-community https://prometheus-community.github.io/helm-charts
helm repo add grafana https://grafana.github.io/helm-charts
helm repo update
2. Install Prometheus
To install Prometheus:
helm install prometheus prometheus-community/kube-prometheus-stack --namespace monitoring --create-namespace
3 Install Grafana
Grafana installation requires a values.yaml file, which includes configurations like default data sources and dashboards. Download the file from the provided URL:
wget https://raw.githubusercontent.com/brainupgrade-in/dockerk8s/main/misc/observability/values.yaml
Install Grafana using this values file:
helm install grafana grafana/grafana --namespace monitoring --values values.yaml --set service.type=NodePort
This sets the Grafana service to NodePort, allowing external access.
Accessing Grafana
To access Grafana, you need the IP of the node and the NodePort on which Grafana is exposed. Use this command:
echo "http://$(docker inspect -f '{{range .NetworkSettings.Networks}}{{.IPAddress}}{{end}}' k8s-monitoring-control-plane):$(kubectl get svc -l app.kubernetes.io/name=grafana -n monitoring -ojsonpath='{.items[0].spec.ports[0].nodePort}')"
This command fetches the IP address of the control plane node and the NodePort dynamically.
Grafana Credentials
The default username for Grafana is admin. To obtain the password, use:
kubectl get secret --namespace monitoring grafana -o jsonpath="{.data.admin-password}" | base64 --decode ; echo
Exploring Grafana Dashboards
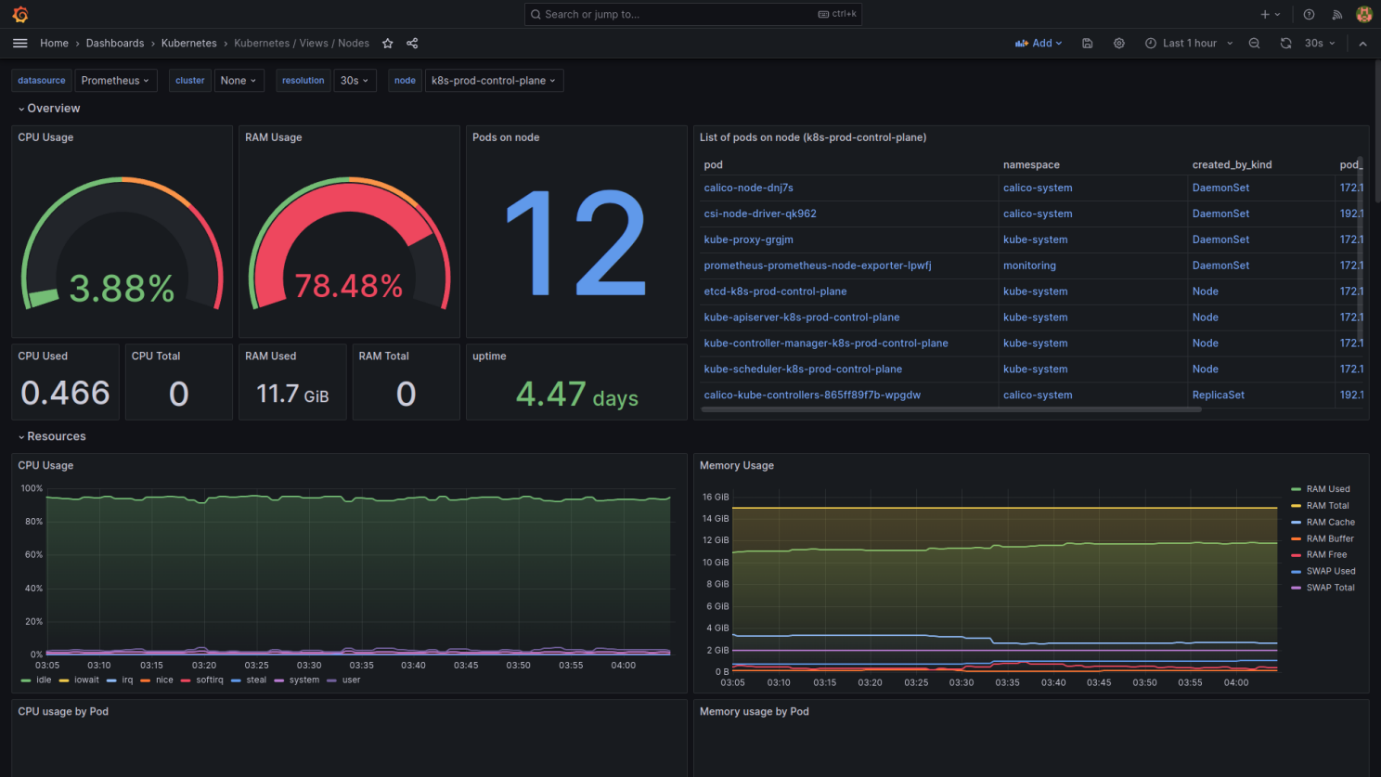
Grafana is preloaded with several dashboards for Kubernetes monitoring, including the 'k8s-views-nodes' dashboard. This dashboard provides a comprehensive view of node metrics, offering insights into resource usage, performance, and health status of your Kubernetes nodes.
The following are a few screenshots from a set of Grafana dashboards designed to monitor the health and performance of a Kubernetes cluster (pre-bundled with Grafana in our case). These dashboards provide a wealth of information about the cluster's resources, such as CPU and memory utilization, network I/O, storage, and system load.
I'll explain the key components present in these dashboards:
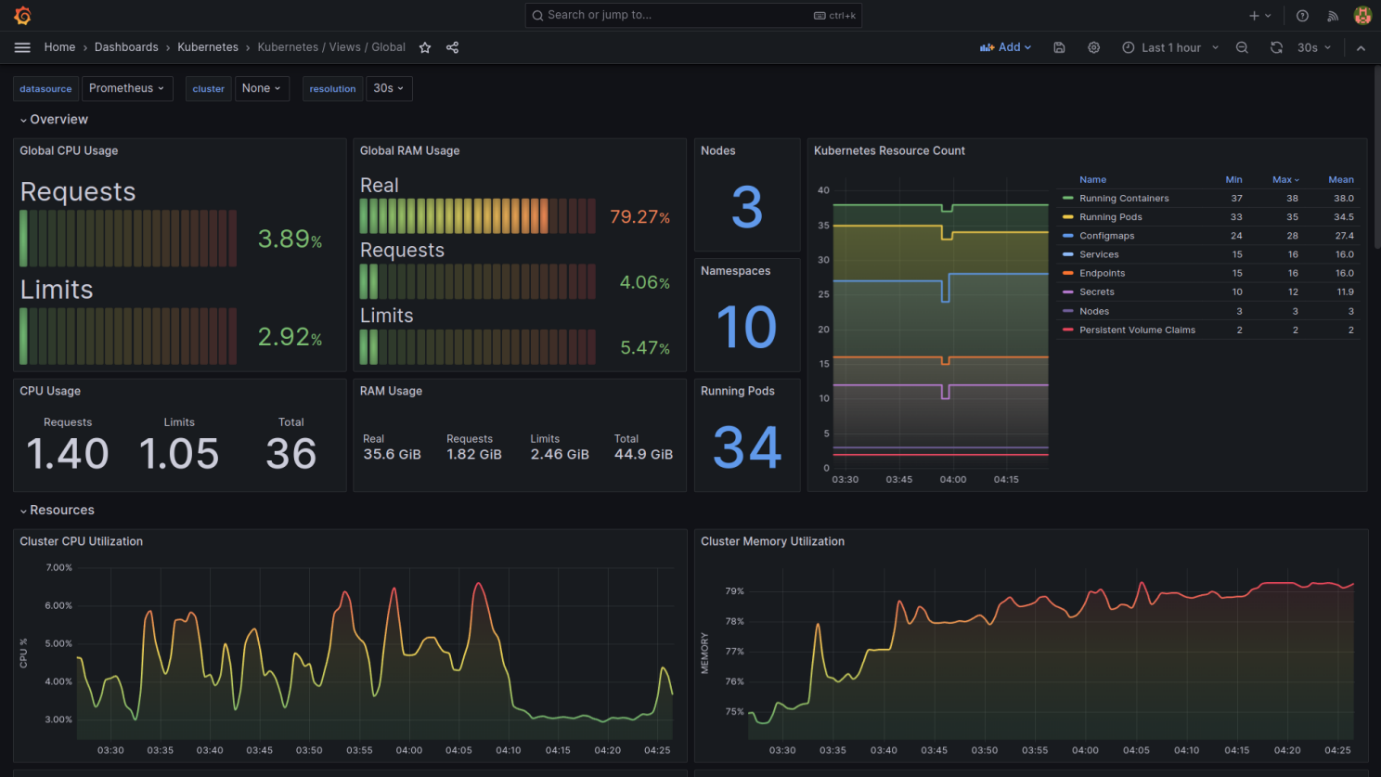
Global-View Dashboard
- Global CPU and RAM Usage: This shows the overall CPU and memory usage across all nodes in the cluster. The "Requests" and "Limits" indicate what percentage of the requested and maximum allowed resources are being used.
- Kubernetes Resource Count: Displays the count of various Kubernetes resources such as nodes, namespaces, and pods. This is useful to quickly understand the scale of the cluster.
- Cluster CPU/Memory Utilization Graphs: These line graphs show the trends in CPU and memory utilization over time, which helps in identifying patterns and potential resource bottlenecks.
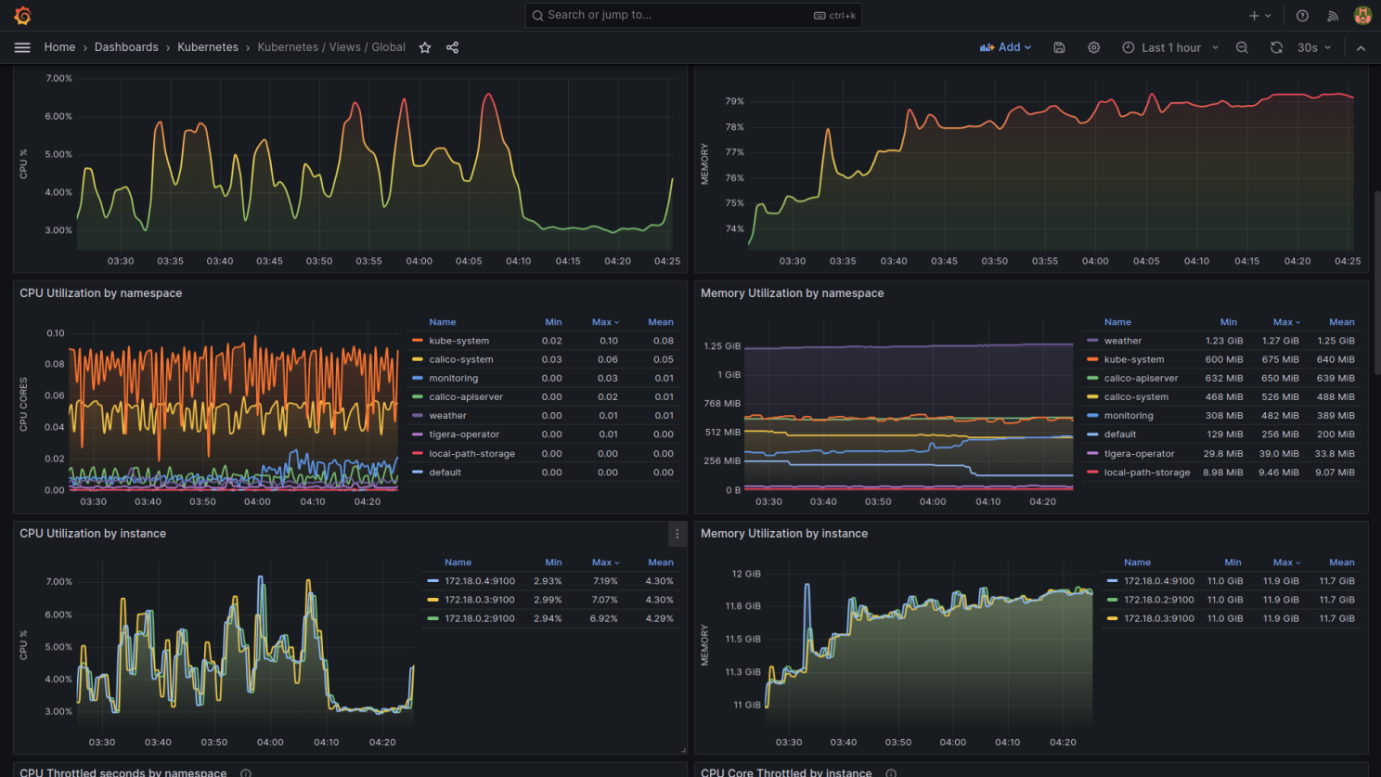
Namespace and Instance View Dashboard
- CPU and Memory Utilization by Namespace: This section provides a breakdown of CPU and memory usage by different namespaces, allowing you to see which namespaces are consuming the most resources.
- CPU and Memory Utilization by Instance: Similar to namespace utilization, this shows resource usage by individual instances or pods. It's essential for pinpointing specific pods that may be using an unusually high amount of resources.
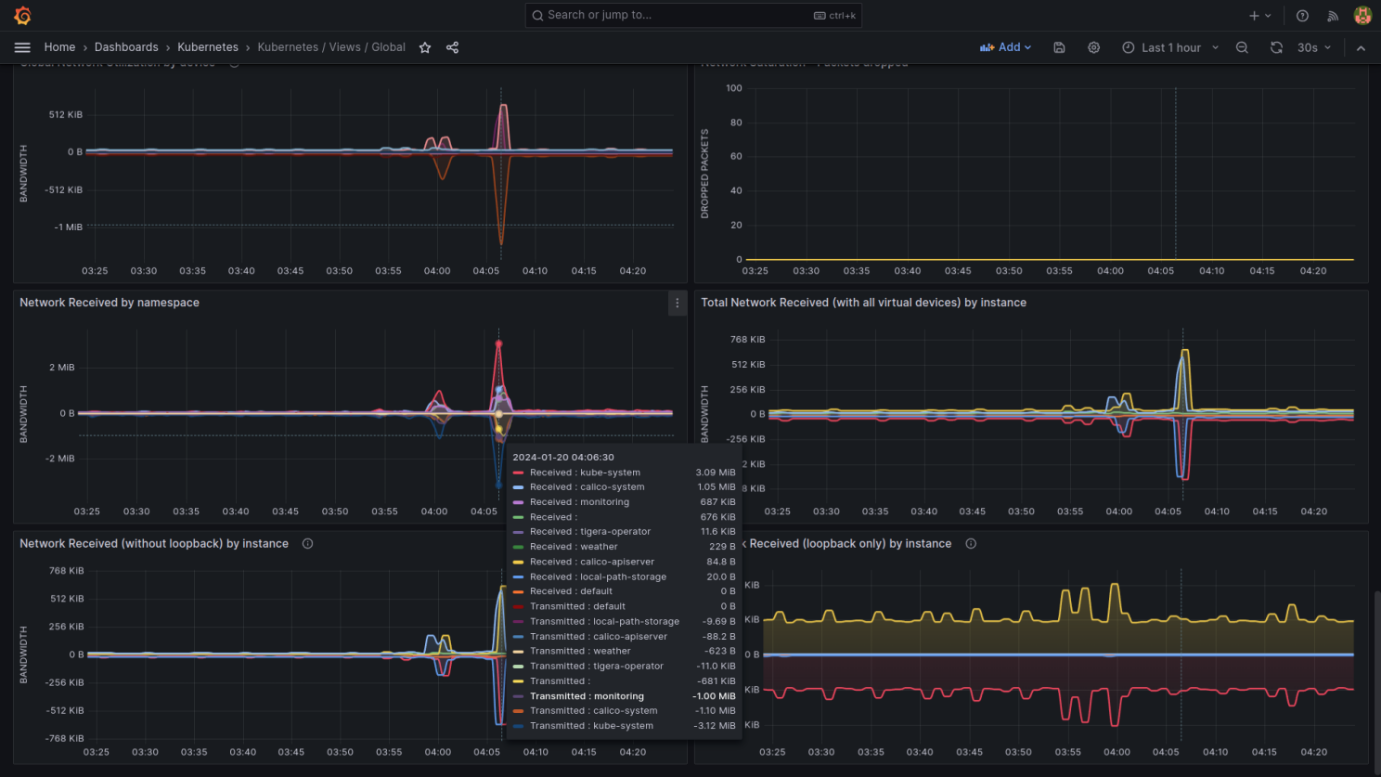
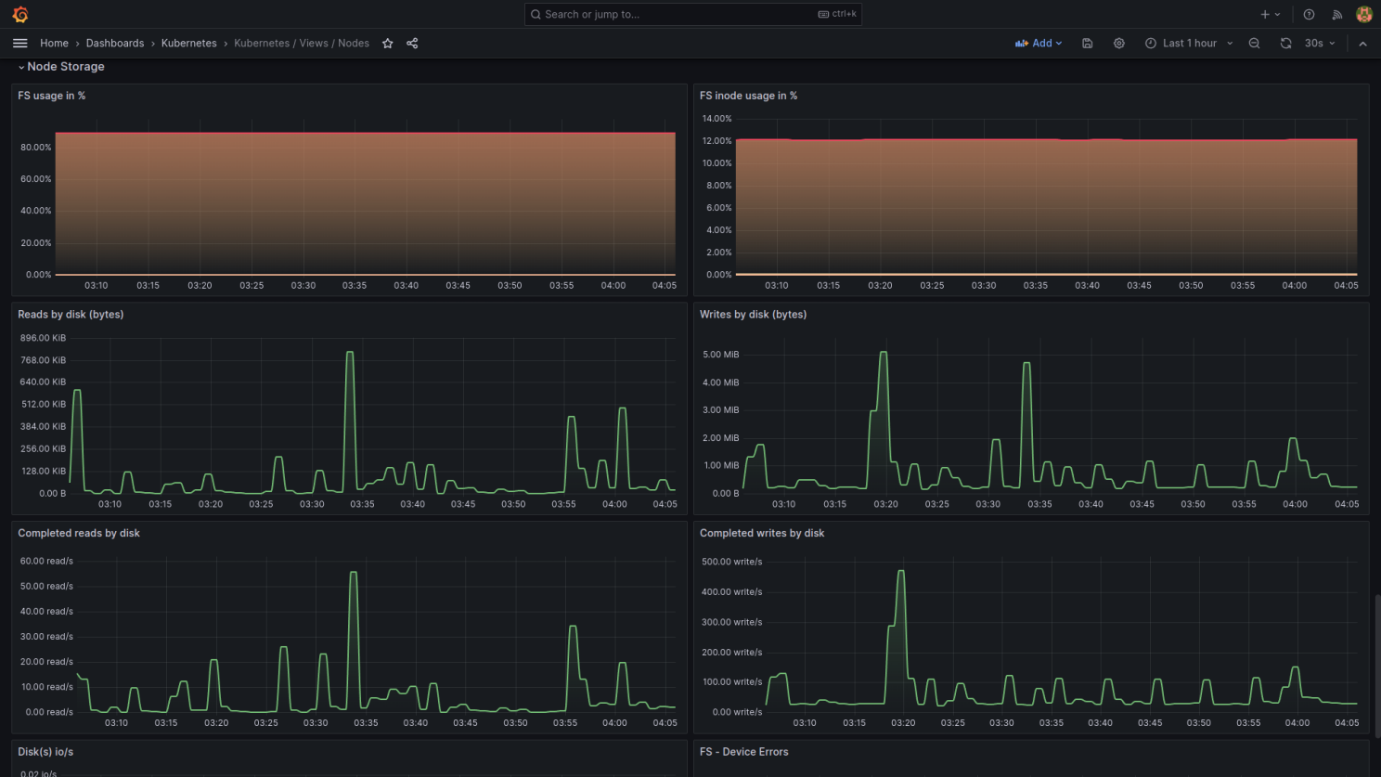
Network and Storage View Dashboard
- Network Utilization: Includes graphs for network traffic received and transmitted by namespace, instance, and network errors and drops. These metrics are crucial for troubleshooting network issues.
- Storage Utilization: Shows file system usage in percentage, read/write operations by disk, and completed I/O operations. These indicators are vital for assessing if the storage provisioned for the cluster meets the demand.
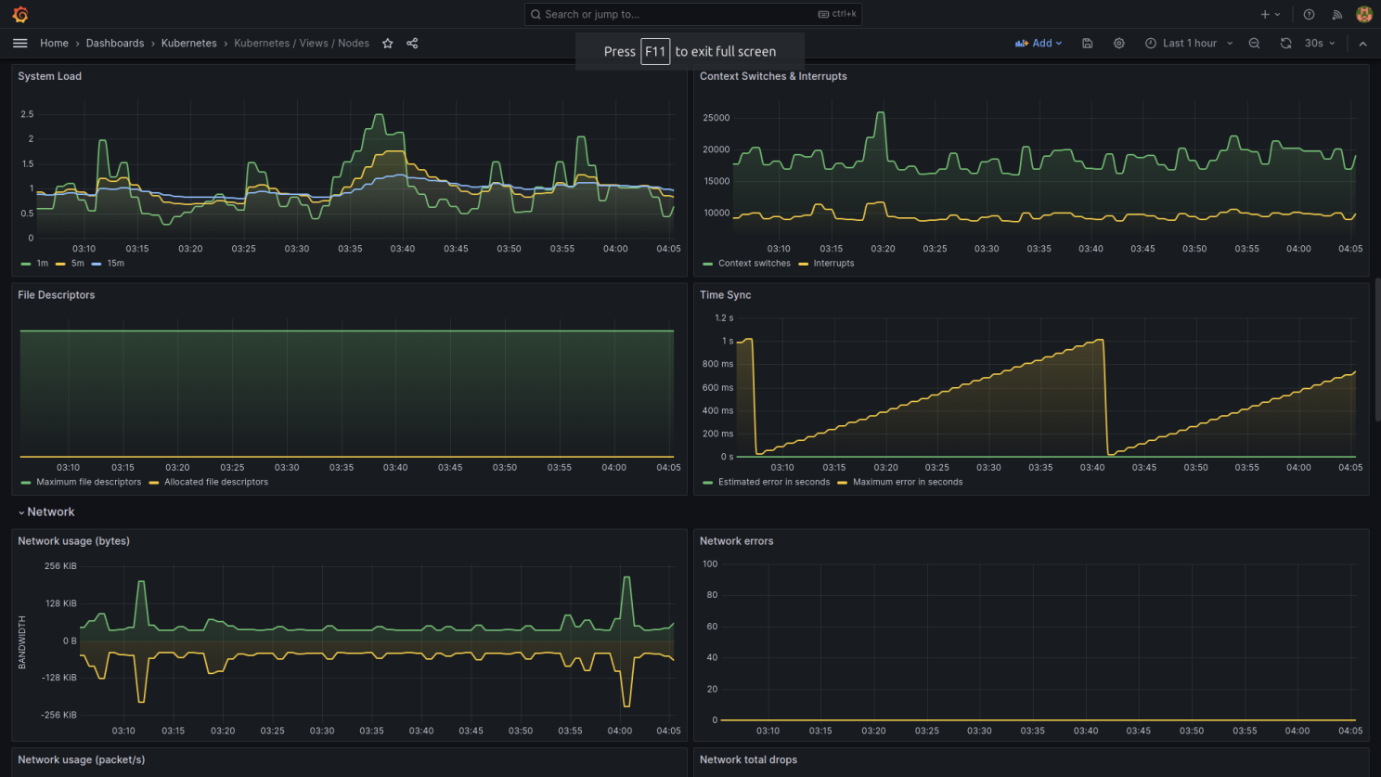
Nodes View Dashboard
- System Load and Network: Presents a graph of system load over time, network usage, and errors. System load metrics are essential for understanding the stress on each node's resources.
- File Descriptors and Time Sync: Indicates the number of file descriptors used and time synchronization accuracy, which can affect the performance and coordination of distributed applications.
- Detailed Node Metrics: Includes CPU and memory usage, pods on a node, and specific pod resource usage. This dashboard is particularly useful for node-level resource monitoring and capacity planning.
Each of these dashboards is customizable and can include additional metrics as required. They are a starting point for in-depth monitoring and can be extended to include logs, alerts, and custom metrics that are critical to your specific Kubernetes environment. Understanding these dashboards helps in proactive monitoring, ensuring high availability and optimal performance of the Kubernetes cluster.
Conclusion
Monitoring is not just about collecting data; it's about gaining actionable insights. With Prometheus and Grafana, you harness the power of metrics and visualization to keep your Kubernetes clusters performing optimally. This setup, coupled with the ease of KIND, provides a robust, scalable, and accessible way to monitor Kubernetes environments.
Remember, the journey to monitoring nirvana is ongoing. As Kubernetes evolves, so should your monitoring strategies. Stay curious, keep learning, and embrace the power of Prometheus and Grafana to unlock the full potential of your Kubernetes clusters.
We Provide consulting, implementation, and management services on DevOps, DevSecOps, DataOps, Cloud, Automated Ops, Microservices, Infrastructure, and Security
Services offered by us: https://www.zippyops.com/services
Our Products: https://www.zippyops.com/products
Our Solutions: https://www.zippyops.com/solutions
For Demo, videos check out YouTube Playlist: https://www.youtube.com/watch?v=4FYvPooN_Tg&list=PLCJ3JpanNyCfXlHahZhYgJH9-rV6ouPro
If this seems interesting, please email us at [email protected] for a call.
Recent Comments
No comments
Leave a Comment
We will be happy to hear what you think about this post