Beginner’s Guide to Vector Similarity Search

Let's explore the different techniques of vector similarity search such as Manhattan distance, Euclidean distance, Cosine distance and dot product.
In the multifaceted world of generative AI, data science, machine learning, and analytics, understanding the distance and relationship between data points is crucial. This is how Large Language Models (LLMs) understand the context and retrieve the data. Large amounts of unstructured data can be easily stored in a vector database that is represented in a three-dimensional space.
Whenever a user comes up with a query, the most approximate answer is retrieved from the database. It is amazing to see how the data is stored and how this calculation retrieves particular information.
There are many advanced ways to calculate the distance between the vectors. In this article, we are going to explore some important distance metrics like Manhattan distance, Euclidean distance, Cosine distance, and dot product.
What Are Vectors in the Context of Machine Learning?

In the realm of generative AI, vectors play a crucial role as a means of representing and manipulating complex data. Within this context, vectors are often high-dimensional arrays of numbers that encode significant amounts of information. For instance, in the case of image generation, each image can be converted into a vector representing its pixel values or more abstract features extracted through deep learning models.
These vectors become the language through which AI algorithms understand and generate new content. By navigating and modifying these vectors in a multidimensional space, generative AI produces new, synthetic instances of data — whether images, sounds or text — that mimic the characteristics of the original dataset. This vector manipulation is at the heart of AI's ability to learn from data and generate realistic outputs based on that learning.
What Is Vector Similarity Search?
Queries involve finding the nearest neighbors to a given vector in the high-dimensional space. This process, known as vector similarity search or Approximate Nearest Neighbor (ANN) search, looks for vectors that are closest in terms of distance (e.g., Euclidean distance or Cosine similarity) to the query vector. This method captures the similarity in context or features between different data points, crucial for tasks like recommendation systems, similarity searches and clustering.

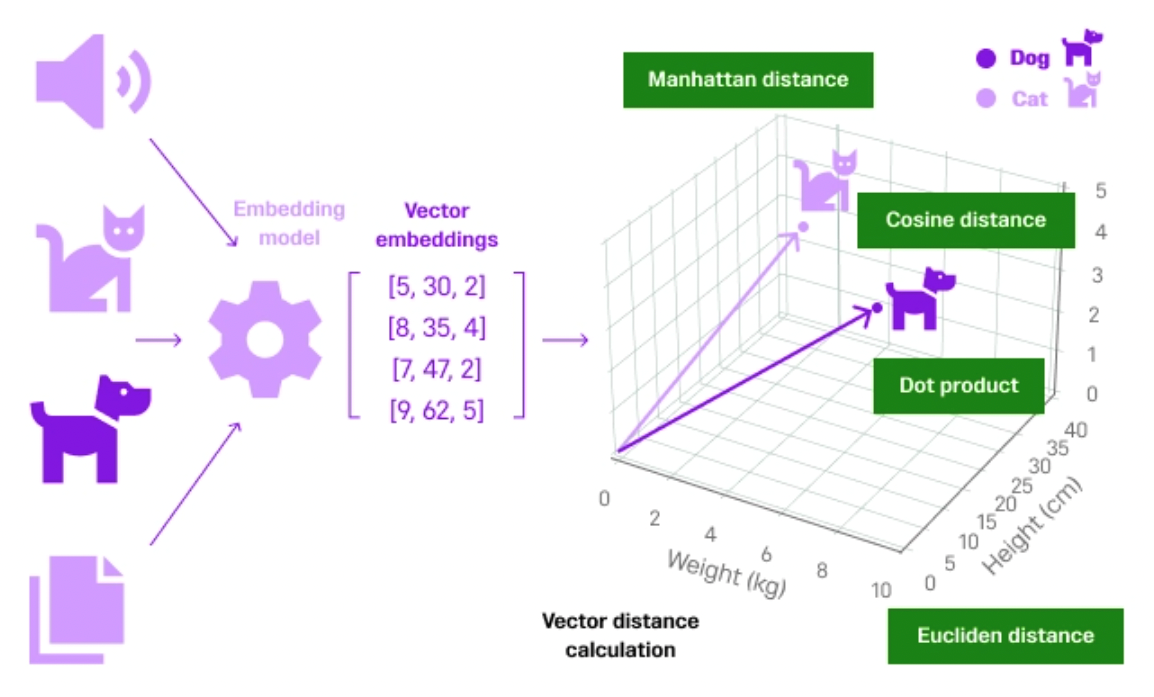
Consider the unstructured data from various sources, as shown in the previous image. The data passes through an embedding model (from OpenAI, Cohere, HuggingFace, etc.) to convert the content into small word chunks (vector embeddings). Each word chunk is assigned a numerical value, and this process is known as tokenization. After the vector embeddings are created, they are represented in a three-dimensional space inside the vector database, where all this vector data is stored.
In our case, as shown in the preceding image, the unstructured data ‘cat’ and ‘dog’ has been converted into vector data first, then represented in a three-dimensional space closer to each other since they both belong to the same pets category. If we consider one more example of a ‘car’ here, then it gets a representation far away from the ‘cat’ and ‘dog’ since it doesn’t fall under the pets category.
This way the similar objects are placed together and when a user query comes in, the context is considered and a more similar object is retrieved back to the user.
How Vector Similarity Search Is Calculated
There are different techniques to calculate the distance between the vectors. Dot product, Euclidean distance, Manhattan distance and cosine distance are all fundamental concepts used in vector similarity search. Each one measures the similarity between two vectors in a multi-dimensional space.
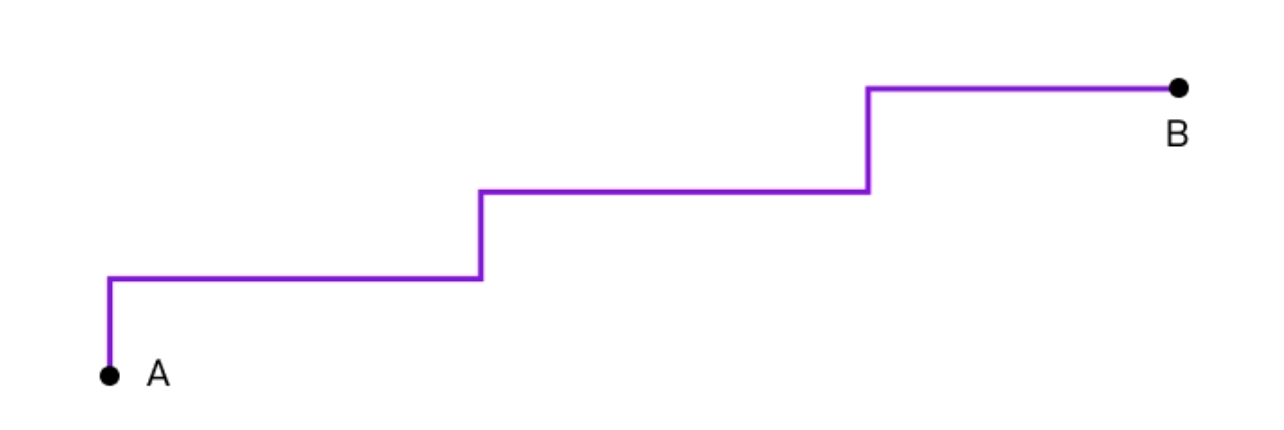
Manhattan Distance
Manhattan distance is a way of calculating the distance between two points (vectors) by summing the absolute differences of their coordinates. Imagine navigating a city laid out in a perfect grid: the Manhattan distance between two points is the total number of blocks you'd have to travel vertically and horizontally to get from one point to the other without the possibility of taking a diagonal shortcut. In the context of vectors, it's similar: you calculate the distance by adding up the absolute differences for each corresponding component of the vectors.
Euclidean Distance
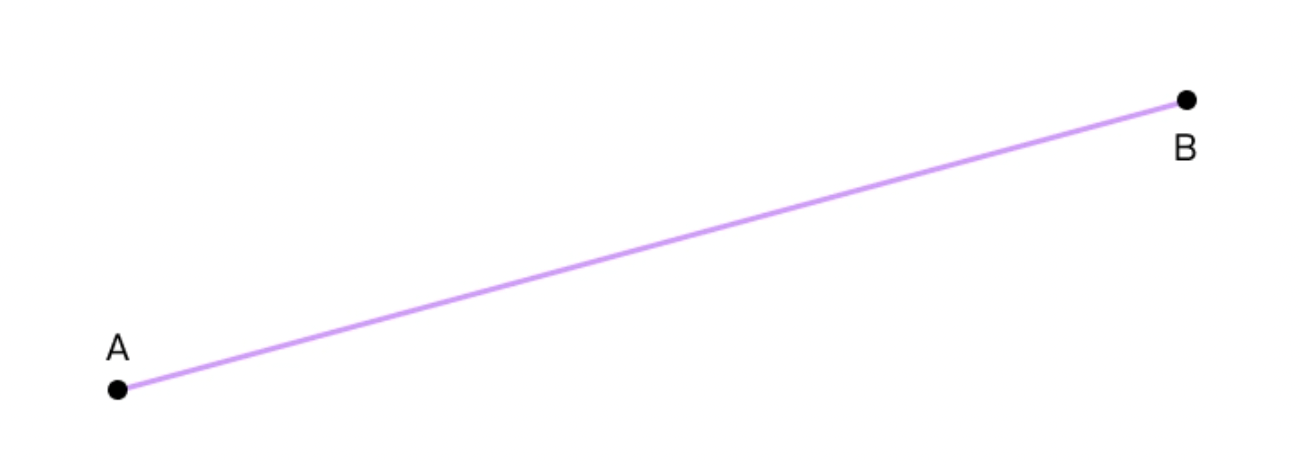
Euclidean distance, often known as the L2 norm, is the most direct way of measuring the distance between two points or vectors, resembling the way we usually think about distance in the physical world. Imagine drawing a straight line between two points on a map; the Euclidean distance is the length of this line.
This metric is widely used in many fields, including physics for measuring actual distances, machine learning algorithms for tasks like clustering and classification, and in everyday scenarios whenever a direct or as-the-crow-flies distance needs to be determined. Its natural alignment with our intuitive understanding of distance makes it a fundamental tool in data analysis and geometry.
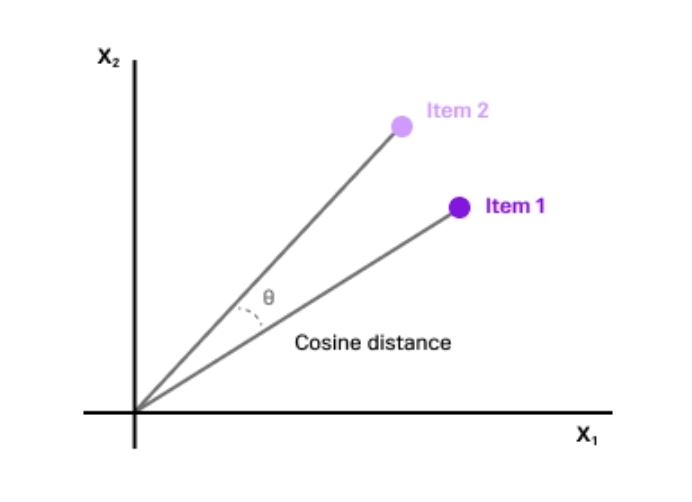
Cosine Distance
Cosine distance is a measure of similarity between two non-zero vectors that evaluates the cosine of the angle between them. It's not a 'distance' in the traditional sense but rather a metric that determines how vectors are oriented relative to each other, regardless of their magnitude. Picture two arrows starting from the same point; the smaller the angle between them, the more similar they are in the direction.
This measure is particularly useful in fields like text analysis and information retrieval, where the orientation of the vectors (representing, for example, documents or queries in a high-dimensional space) matters more than their absolute positions or magnitudes.
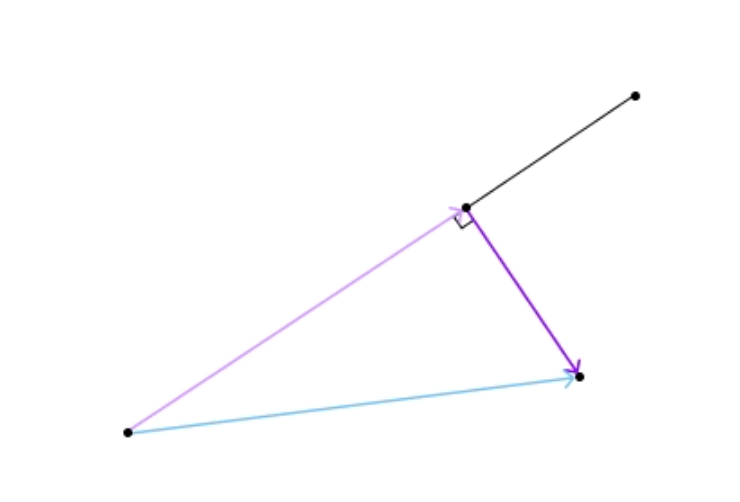
Dot Product
The dot product captures the relationship between two vectors. Imagine two arrows extending from the same starting point; the dot product quantifies how much one arrow aligns with the direction of the other. Mathematically, it's calculated by multiplying corresponding components of the vectors and then summing these products.
A key characteristic of the dot product is that it's large (positive or negative) when vectors point in similar or opposite directions and small (or zero) when the vectors are perpendicular. This makes the dot product extremely useful in various applications, like determining if two vectors are orthogonal calculating the angle between vectors in space, or in more complex physics and engineering operations like computing work or torque. In machine learning and data science, the dot product is instrumental in algorithms like neural networks, where it helps in calculating the weighted sum of inputs.
Tutorial
We will use SingleStore Notebooks to perform this tutorial. If you haven’t already, activate your SingleStore trial free to get started. Let’s dive deeper into the previously mentioned approaches through a hands-on tutorial.
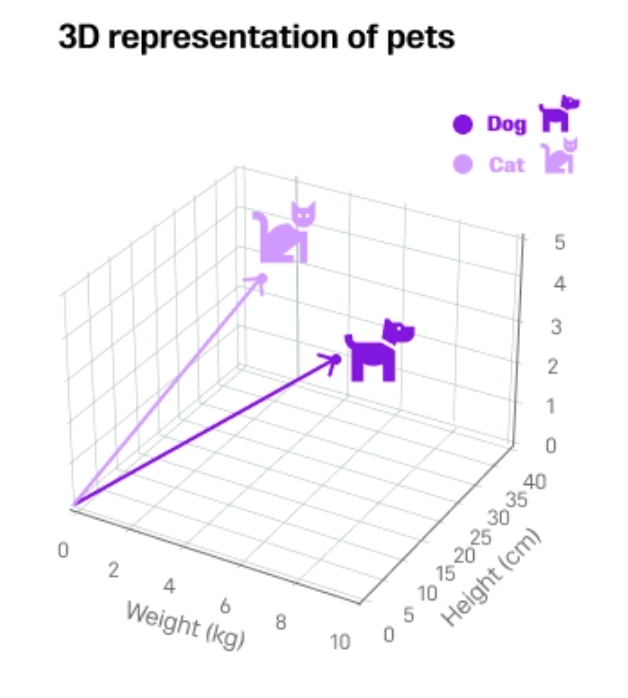
Let's take an example of two pets (cat and dog) and visualize them in a 3D space. We will try to find the Manhattan distance, Euclidean distance, Cosine distance, and dot product between these two pets.


Once you sign up, click on the Notebooks tab and create a blank Notebook with a name.
You can start running the code in your newly created Notebook. First, install and then import the required libraries.
!pip install numpy
!pip install matplotlib
import matplotlib.pyplot as plt
import numpy as np
Define attributes of the pets that can be represented in three dimensions. Since pets are complex entities with many characteristics, you'll need to simplify this to a 3D representation. Here's an example:
from mpl_toolkits.mplot3d import Axes3D
# Example pets attributes: [weight, height, age]
# These are hypothetical numbers for illustration purposes
dog = [5, 30, 2]
6
cat = [3, 25, 4]
fig = plt.figure()
ax = fig.add_subplot(111, projection='3d')
# Plotting the pets
ax.scatter(dog[0], dog[1], dog[2], label="Dog", c='blue')
ax.scatter(cat[0], cat[1], cat[2], label="Cat", c='green')
# Drawing lines from the origin to the points
ax.quiver(0, 0, 0, dog[0], dog[1], dog[2], color='blue',
arrow_length_ratio=0.1)
ax.quiver(0, 0, 0, cat[0], cat[1], cat[2], color='green',
arrow_length_ratio=0.1)
# Labeling the axes
ax.set_xlabel('Weight (kg)')
ax.set_ylabel('Height (cm)')
ax.set_zlabel('Age (years)')
# Setting the limits for better visualization
ax.set_xlim(0, 10)
ax.set_ylim(0, 40)
ax.set_zlim(0, 5)
# Adding legend and title
ax.legend()
ax.set_title('3D Representation of Pets')
plt.show()
Upon executing the code, you should be able to see the representation of pets mentioned in this 3D space.
Now, let’s calculate the distance between the vectors using various techniques.
Manhattan Distance
L1 = [abs(dog[i] - cat[i]) for i in range(len(dog))]
manhattan_distance = sum(L1)
print("Manhattan Distance:", manhattan_distance)
Euclidean Distance
L2 = [(dog[i] - cat[i])**2 for i in range(len(dog))]
L2 = np.sqrt(np.array(L2).sum())
print(L2)
Cosine Distance
cosine = np.dot(dog, cat) / (np.linalg.norm(dog) *
np.linalg.norm(cat))
print(cosine)
Dot Product
np.dot(dog,cat)
The complete code of this tutorial can be found here in this GitHub repository: Representing Unstructured Data as Vectors.
We Provide consulting, implementation, and management services on DevOps, DevSecOps, DataOps, Cloud, Automated Ops, Microservices, Infrastructure, and Security
Services offered by us: https://www.zippyops.com/services
Our Products: https://www.zippyops.com/products
Our Solutions: https://www.zippyops.com/solutions
For Demo, videos check out YouTube Playlist: https://www.youtube.com/watch?v=4FYvPooN_Tg&list=PLCJ3JpanNyCfXlHahZhYgJH9-rV6ouPro
If this seems interesting, please email us at [email protected] for a call.
Recent Comments
No comments
Leave a Comment
We will be happy to hear what you think about this post