RED Method for Prometheus - 3 Key Metrics for Microservices Monitoring
We take a look at how to use this open source platform to monitor and test the performance of your 'as a Service' software using Google's RED method.
You may have heard a lot about Prometheus lately, especially when it comes to monitoring applications in Kubernetes. To provide a bit of background before we delve into the RED method, apps running in containers and orchestrated by Kubernetes are highly automated and dynamic, and so, when it comes to monitoring applications in these environments, traditional server-based monitoring tools designed for static services are not sufficient.
This is where Prometheus comes in.
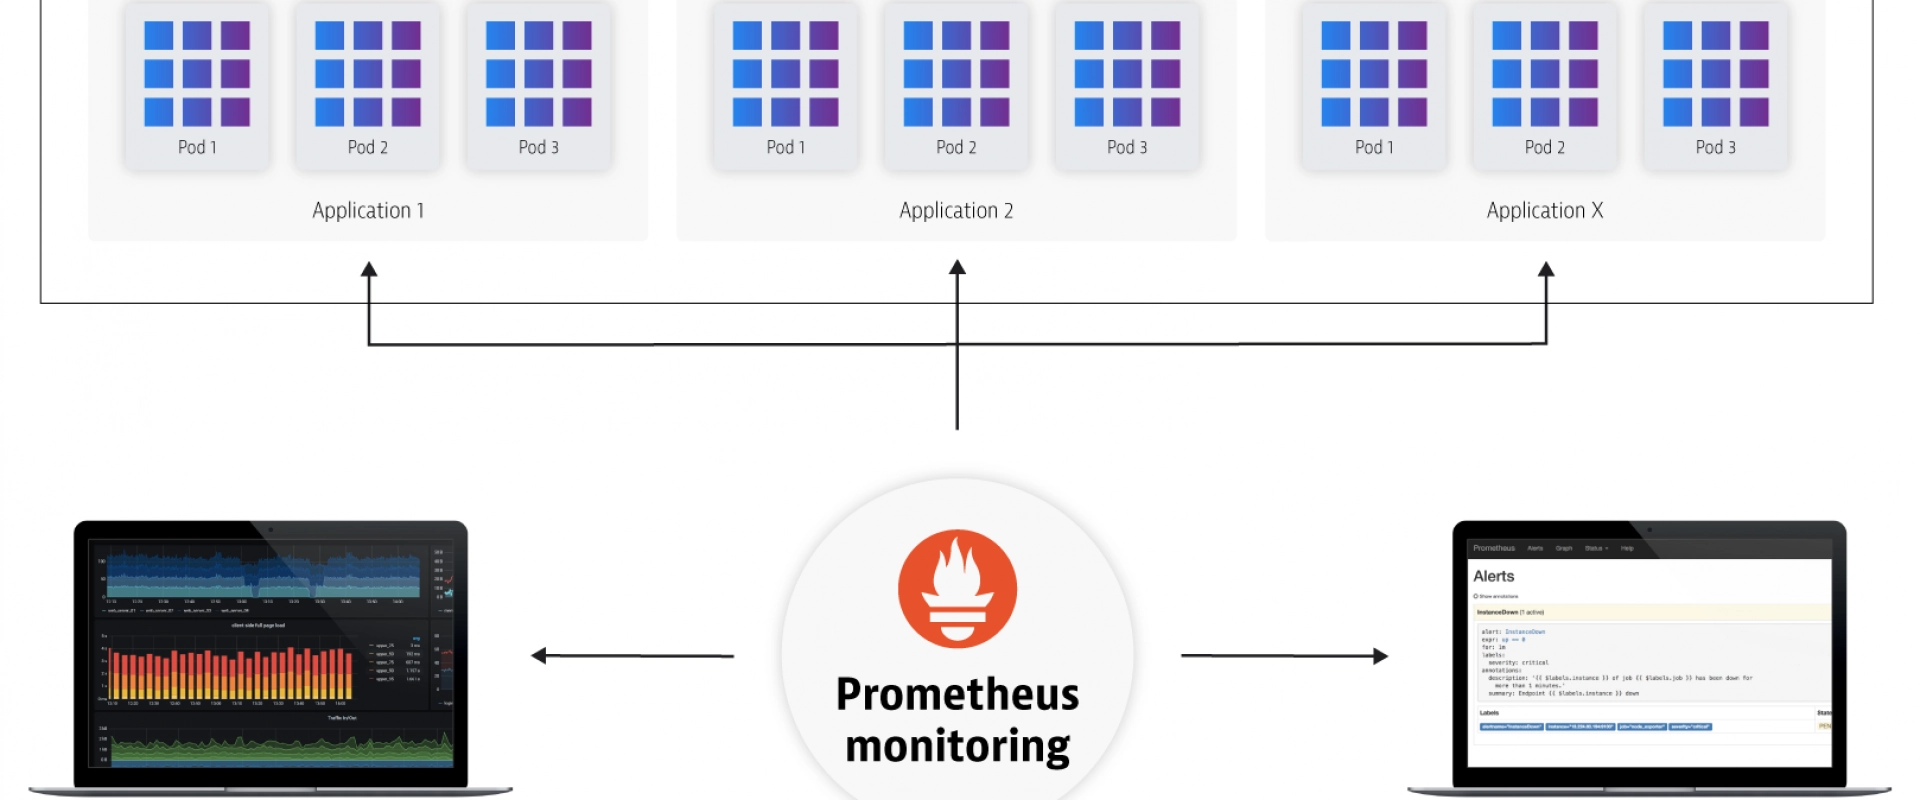
Prometheus is an open source project that was originally developed by engineers at SoundCloud. It was built and designed specially to monitor microservices that run in containers. Data is scraped from running services at time intervals and saved to a time-series database where it can be queried via the PromQL language. Because the data is stored as a time series, it allows you to explore those time intervals to diagnose problems when they occurred and to also analyze long-term monitoring trends with your infrastructure -- two awesomely powerful features of Prometheus.
Weaveworks built on the open source distribution of Prometheus and created a scalable, multi-tenant version that is part of our Software-as-a-Service called Weave Cloud.
After having run this service for several months now, and by using Weave Cloud to monitor itself, we’ve learned a few things about monitoring cloud-native applications and devised a system that we use in determining what to measure before instrumenting code.
What to Instrument?
One of the most important decisions to make when setting up Prometheus Monitoring is deciding on the type of metrics you need to collect about your app. The metrics you choose simplify troubleshooting when a problem occurs and also enables you to stay on top of the stability of your services and infrastructure. To help us think about what’s important to instrument, we defined a system that we call the RED method.
The RED method follows the principles outlined in the Four Golden Signals developed by Google Site Reliability Engineers or SREs, which focuses on measuring things that end-users care about when using your web services.
With the RED method, three key metrics are instrumented that monitor every microservice in your architecture:
· (Request) Rate - the number of requests, per second, your services are serving.
· (Request) Errors - the number of failed requests per second.
· (Request) Duration - the amount of time each request takes expressed as a time interval.
Rate, Errors, and Duration attempt to cover the most obvious web service issues. These metrics also capture an error rate that is expressed as a proportion of request rate.
With these three basic metrics, we believe the most common problems that can result in poor customer satisfaction are covered.
For even more detailed coverage, you may also include the Saturation metric. Saturation is used in another methodology called the USE or Utilization, Saturation and Errors method and it refers to a resource with extra work that can’t be serviced and therefore must be added to the queue for later processing.
USE vs. RED Methods
The USE method focuses more on monitoring performance and is
meant to be used as a starting point in identifying the root cause of
performance issues and other systemic bottlenecks.
Ideally, both the USE and the RED Methods can be used together when monitoring
your applications.
Why You Should Measure the Same Metrics for Every Service
From a monitoring perspective, the benefit of treating each service the same is scalability in your operations teams.
What does scalability of an operations team mean?
We look at this from the point of view of how many services a given team can support. In an ideal world, the number of services the team can support would be independent of its team size, and instead dependent on other factors like what kind of response SLA you want, and whether you need 24/7 coverage, etc.
How do you decouple the number of services you can support from the team size?
By making every service look, feel, and taste the same. This reduces the amount of service-specific training the team needs, and also reduces the service-specific special cases the on-calls need to memorize for those high-pressure incident response scenarios or what is referred to as “cognitive load.”
Capacity Planning
Do it as a function of QPS and latency.
Automating Tasks and Creating Alerts
An advantage of the RED method is that it helps you to think about how to display information in your dashboards. With just these three metrics, you can standardize on the layout of your dashboards to make it even simpler to read and to create alerts on for when there is a problem. For example, a possible layout might entail a different Weave Cloud notebook for each service with PromQL queries for request/error and latency for each of those services.
Also, it goes without saying, but if you treat all your services the same, repetitive tasks are more easily automated.
RED Method Metrics Monitored in Weave Cloud
Limitations
It is fair to say this method only works for request-driven services - it breaks down for batch-oriented or streaming services for instance. It is also not all-encompassing. There are times you will need to monitor other things - the USE Method, for example, is great when applied to resources like host CPU and Memory, or caches.
We Provide consulting, implementation, and management services on DevOps, DevSecOps, DataOps, Cloud, Automated Ops, Microservices, Infrastructure, and Security
Services offered by us: https://www.zippyops.com/services
Our Products: https://www.zippyops.com/products
Our Solutions: https://www.zippyops.com/solutions
For Demo, videos check out YouTube Playlist: https://www.youtube.com/watch?v=4FYvPooN_Tg&list=PLCJ3JpanNyCfXlHahZhYgJH9-rV6ouPro
If this seems interesting, please email us at [email protected] for a call.
Recent Comments
No comments
Leave a Comment
We will be happy to hear what you think about this post